
We prototype a waterfall display reconstructed from decoded data and rendered with d3. This shows digital ham radio activity at 14 MHz that depends on daytime ionospheric skip. chart ![]() github
github ![]()
Frequency is horizontal. Age increases vertically. Previously contacted stations show as tan. enlarge 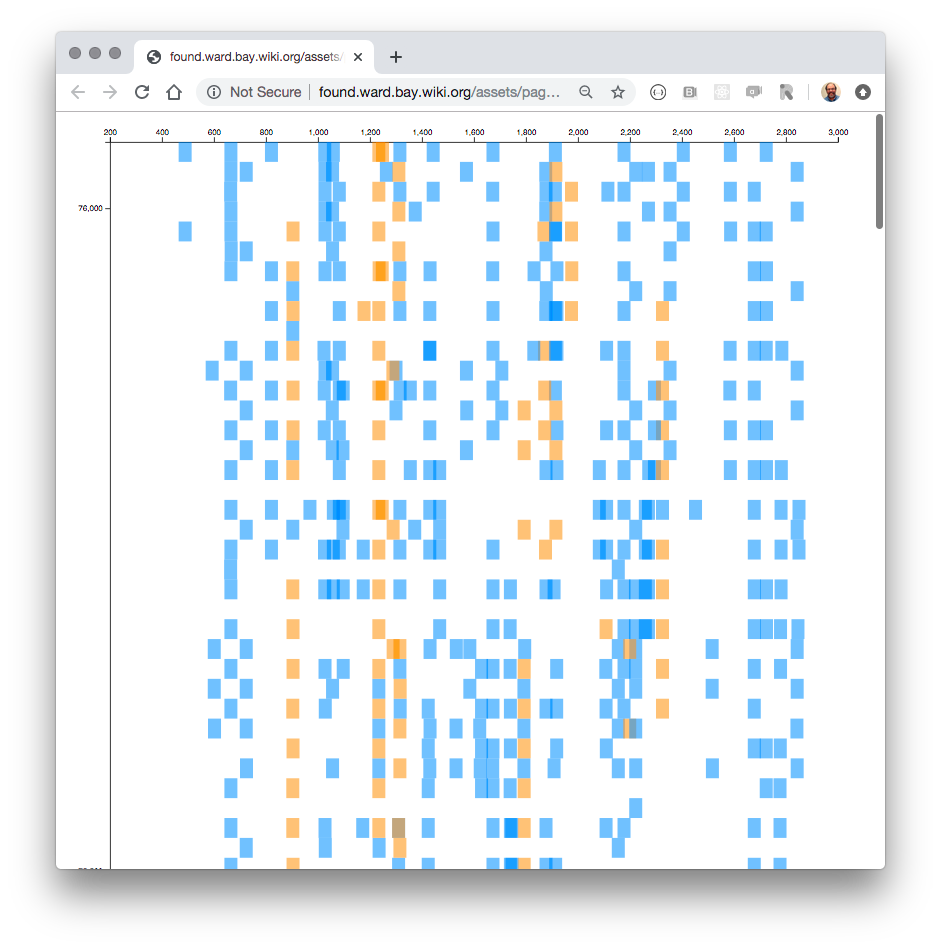
We imagine a basemap constructed from stacked layers of the decode waterfall corresponding to reporting radios. We will then interactively decorate this with information like signal strength, script state, and other decodes related to individual transmissions. See Waterfall Decorations
digraph { rankdir=LR node [shape=box style=filled fillcolor=bisque] "Portland\nDecoder" -> "WSJT\nPlugin" "Medford\nDecoder" -> "WSJT\nPlugin" -> "Datalog\nPlugin" -> "Unity\nApp" -> "TableTop\nVisualization" }
# Prototype
Try a version built from a static capture. chart ![]()
pages/decode-waterfall
Observed P49X Concurrent Contacts. chart ![]()
Save some new test data with curl.
curl http://ward.asia.wiki.org/plugin/wsjt/copy \ > 3pm.txt
Update the demo waterfall.html here.
The WSJT-X application creates a variety of logs. Here we upload the log kept in ADIF format for use elsewhere.
Advanced D3 Technique to study for coding tips
Three.js Fundamentals where we repeat this work in 3d.